Cure dependent censoring regression models for long-term survival multivariate data.
You can install the development version of CureDepCens from GitHub with:
install.packages("devtools")
devtools::install_github("GabrielGrandemagne/CureDepCens")This is a basic example which shows you how to solve a common problem:
library(devtools)
#> Carregando pacotes exigidos: usethis
library(CureDepCens)
load_all()
#> ℹ Loading CureDepCens
Dogs_MimicData <- Dogs_MimicData
delta_t = ifelse(Dogs_MimicData$cens==1,1,0)
delta_c = ifelse(Dogs_MimicData$cens==2,1,0)

# MEP
fit <- cure_dep_censoring(formula = time ~ x1_cure + x2_cure | x_c1 + x_c2,
                           data = Dogs_MimicData,
                           delta_t = delta_t,
                           delta_c = delta_c,
                           ident = Dogs_MimicData$ident,
                           dist = "mep")
summary_cure(fit)
#>
#> MEP approach
#>
#> Name  Estimate    Std. Error  CI INF      CI SUP      p-value
#> Alpha    2.034930    0.2005083   1.641933    2.427926    3.044e-26
#> Theta    0.7787554   0.4238412   0.000000    1.609484
#>
#> Coefficients Cure:
#>
#> Name  Estimate    Std. Error  CI INF      CI SUP      p-value
#> Interc   -0.6976047  0.1781988   -1.046874   -0.3483351  7.141e-33
#> x1_cur   0.514533    0.1703999   0.1805492   0.8485168   7.419e-18
#> x2_cur   0.2017428   0.08103922  0.04290593  0.3605797   0.001578
#>
#> Coefficients C:
#>
#> Name  Estimate    Std. Error  CI INF      CI SUP      p-value
#> x_c1 0.03219111  0.1625781   -0.286462   0.3508442   0.1122
#> x_c2 -0.318467   0.1609394   -0.6339082  -0.003025754    4.682e-12
#>
#> ----------------------------------------------------------------------------------
#>
#> Information criteria:
#>
#> AIC   BIC      HQ
#> 510.9032 574.7666 536.194
Dogs_MimicData is our simulated data frame. For more information check the documentation for stored datasets.
head(Dogs_MimicData)
#> u v t c time event int x1_cure
#> 1 0.56788087 0.83359383 0.4131564 0.3614745 0.3614745 0 1 0
#> 2 0.66013804 0.72909631 1.0968927 2.1033648 1.0968927 1 1 1
#> 3 0.06854872 0.63332194 Inf 1.6510975 1.6510975 0 1 1
#> 4 0.88345952 0.57152197 0.6522436 8.6456149 0.6522436 1 1 1
#> 5 0.45431855 0.92452776 0.9258282 0.5216269 0.5216269 0 1 1
#> 6 0.12120571 0.02350277 Inf 10.9070711 5.1121398 0 1 1
#> x2_cure x_c1 x_c2 cens ident
#> 1 0.5228382 1.0403070 0 2 1
#> 2 -0.4207129 0.1071675 1 1 2
#> 3 -1.1207319 -1.4042911 0 2 3
#> 4 1.1764416 -0.7740067 1 1 4
#> 5 0.3891404 0.4973770 1 2 5
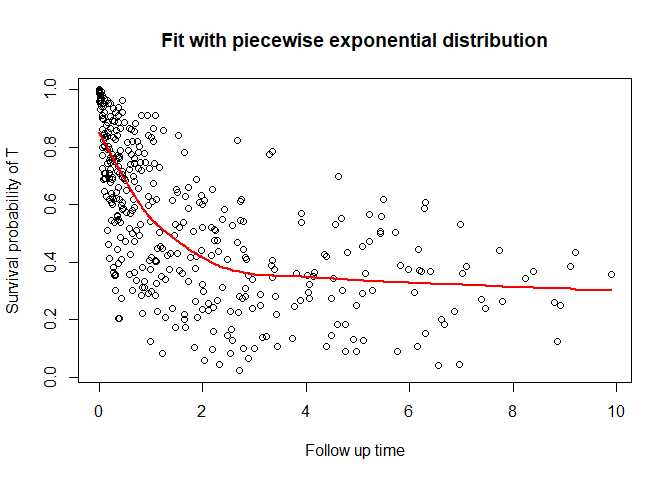
#> 6 0.5580893 -0.2278904 1 3 6You can also plot the survival function
plot_cure(fit, scenario = "t")