The goal of LearnSL is to provide a set of functions to perform supervised classification along with comprehensive explanations of the algorithms, their pros and cons, and their applications.
You can install the released version of LearnSL from CRAN with:
install.packages("LearnSL")You can install the development version of LearnSL from GitHub with:
# install.packages("devtools")
devtools::install_github("ComiSeng/LearnSL")This is a basic example which shows you how to classify a dataset:
library(LearnSL)
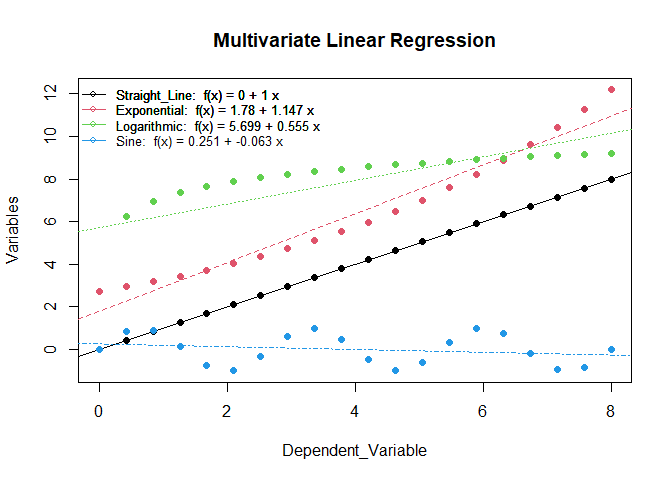
multivariate_linear_regression(db1rl)
This is yet another example of an implemented classification algorithm, showing the step by step process:
library(LearnSL)
knn(db_flowers,"ClassLabel", c(6.7, 1.5, 5.3, 2.1), "Euclidean", 2, details = TRUE, waiting = FALSE)
##
## EXPLANATION
## ________________________________________________________________________________
## ________________________________________________________________________________
##
## Step 1:
## - Calculate the chosen d_method from the value we want to classify to every
## other one.
## Step 2:
## - Select the k closest neighbors and get their classes.
## Step 3:
## - Create a scatterplot matrix with the provided values for visualization pur
## pose
## Step 4:
## - Select the most repeated class among the k closest neighbors classes.
## ________________________________________________________________________________
## ________________________________________________________________________________
##
## Step 1:
##
## Distance from p1 to every other p.
## [1] 5.666469 5.394510 5.586155 5.812633 5.471676 2.978727 2.588349 1.907590
## [9] 2.518859 2.884434 1.368425 1.480560 1.977996 1.869735 1.741970 3.633439
## [17] 4.079999 4.965582 4.571177 5.201494
## ________________________________________________________________________________
##
## Step 2:
##
## These are the first k values classes:
## [1] "virginica" "virginica"
## ________________________________________________________________________________
##
## Step 3:
##
## Plot values.
## ________________________________________________________________________________
##
## Step 4:
##
## The most represented class among the k closes neighbors is virginica
## therefore, that is the new value's predicted class.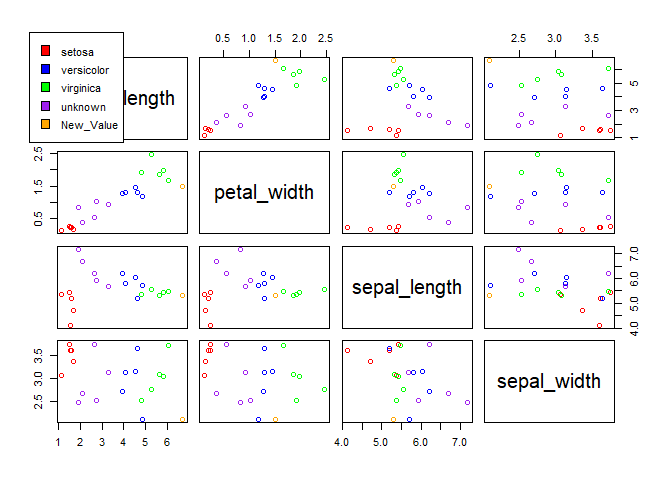
## [1] "virginica"