![]()
The goal of SeedMatchR is to help users identify potential seed-mediated effects in their RNAseq data.
You can install the development version of SeedMatchR from GitHub or the stable build from CRAN.
# Install from GitHub
install.packages("devtools")
devtools::install_github("tacazares/SeedMatchR")This example uses the siRNA sequence, D1, targeting the Ttr gene in rat liver from the publication:
Schlegel MK, Janas MM, Jiang Y, Barry JD, Davis W, Agarwal S, Berman D, Brown CR, Castoreno A, LeBlanc S, Liebow A, Mayo T, Milstein S, Nguyen T, Shulga-Morskaya S, Hyde S, Schofield S, Szeto J, Woods LB, Yilmaz VO, Manoharan M, Egli M, Charissé K, Sepp-Lorenzino L, Haslett P, Fitzgerald K, Jadhav V, Maier MA. From bench to bedside: Improving the clinical safety of GalNAc-siRNA conjugates using seed-pairing destabilization. Nucleic Acids Res. 2022 Jul 8;50(12):6656-6670. doi: 10.1093/nar/gkac539. PMID: 35736224; PMCID: PMC9262600.The guide sequence of interest is 23 bp long and oriented 5’ -> 3’.
# siRNA sequence of interest targeting a 23 bp region of the Ttr gene
guide.seq = "UUAUAGAGCAAGAACACUGUUUU"We use AnnotationHub to derive the GTF and
DNA sequence files for the species of interest. Once you
have derived the annotations, you could save them as an Rdata object to
increase the speed of loading the datasets.
# Load the species specific annotation database object
anno.db <- load_species_anno_db("rat")We will use the annotations to derive the features and feature sequences that we want to scan for each gene.
features = get_feature_seqs(anno.db$tx.db, anno.db$dna, feature.type = "3UTR")The test data that is provided with SeedMatchR was
derived from the 2022 publication by Schlegel et al. The data set
represents a DESeq2 analysis performed on rat liver that had been
treated with Ttr targeting siRNA. We will use this example to explore
seed mediated activity.
We start by downloading the example data set. This function will download three files from the GEO accession GSE184929. These files represent three samples with different siRNA treatments at two dosages.
get_example_data("sirna")We can load the example data into the environment.
sirna.data = load_example_data("sirna")The DESeq2 results are available through the names
Schlegel_2022_Ttr_D1_30mkg,
Schlegel_2022_Ttr_D4_30mkg and
Schlegel_2022_Ttr_D1_10mkg. The data set name is long, so
it will be renamed to res.
res <- sirna.data$Schlegel_2022_Ttr_D1_30mkgThe DESeq2 results file is then filtered. The function
filter_deseq() can be used to filter a results file by
log2FoldChange, padj, baseMean, and remove NA entries.
# Dimensions before filtering
dim(res) # [1] 32883    6
#> [1] 32883     8

# Filter DESeq2 results for SeedMatchR
res = filter_deseq(res, fdr.cutoff=1, fc.cutoff=0, rm.na.log2fc = T)

# Dimensions after filtering
dim(res) # [1] 13582     8
#> [1] 13582 8You can perform a seed match for a single seed using the
SeedMatchR() function.
res = SeedMatchR(res, anno.db$gtf, features$seqs, guide.seq, "mer7m8")

head(res)
#>              gene_id  baseMean log2FoldChange     lfcSE      stat        pvalue
#> 1 ENSRNOG00000016275 2138.0945      -8.164615        NA -23.61818 2.507268e-123
#> 2 ENSRNOG00000000127  437.6342      -1.346927 0.1068629 -12.60425  2.000712e-36
#> 3 ENSRNOG00000047179 1590.1745      -1.262411 0.1031403 -12.23974  1.906387e-34
#> 4 ENSRNOG00000030187  131.9206       3.422725 0.3032352  11.28736  1.515189e-29
#> 5 ENSRNOG00000008050   38.9921      -3.442834 0.3192776 -10.78320  4.132589e-27
#> 6 ENSRNOG00000008816  400.9526       2.794453 0.2661369  10.50006  8.632549e-26
#>            padj symbol mer7m8
#> 1 3.405371e-119    Ttr      1
#> 2  1.358683e-32  Kpna6      0
#> 3  8.630849e-31  Aplp2      1
#> 4  5.144824e-26  Mmp12      0
#> 5  1.122577e-23  Stac3      0
#> 6 1.954121e-22 Gpnmb 0You can perform seed matching for all available seeds using a for loop. The results will be appended as a new column to the results data frame.
for (seed in c("mer8", "mer6", "mer7A1")){
res <- SeedMatchR(res, anno.db$gtf, features$seqs, guide.seq, seed.name = seed)
}

head(res)
#>              gene_id  baseMean log2FoldChange     lfcSE      stat        pvalue
#> 1 ENSRNOG00000016275 2138.0945      -8.164615        NA -23.61818 2.507268e-123
#> 2 ENSRNOG00000000127  437.6342      -1.346927 0.1068629 -12.60425  2.000712e-36
#> 3 ENSRNOG00000047179 1590.1745      -1.262411 0.1031403 -12.23974  1.906387e-34
#> 4 ENSRNOG00000030187  131.9206       3.422725 0.3032352  11.28736  1.515189e-29
#> 5 ENSRNOG00000008050   38.9921      -3.442834 0.3192776 -10.78320  4.132589e-27
#> 6 ENSRNOG00000008816  400.9526       2.794453 0.2661369  10.50006  8.632549e-26
#>            padj symbol mer7m8 mer8 mer6 mer7A1
#> 1 3.405371e-119    Ttr      1    1    1      1
#> 2  1.358683e-32  Kpna6      0    0    0      0
#> 3  8.630849e-31  Aplp2      1    0    1      0
#> 4  5.144824e-26  Mmp12      0    0    0      0
#> 5  1.122577e-23  Stac3      0    0    0      0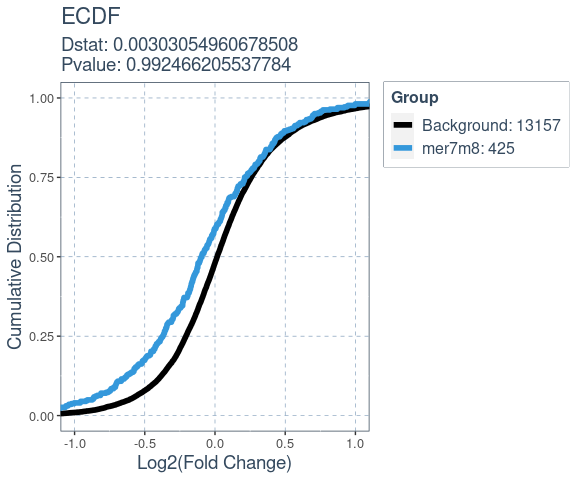
#> 6 1.954121e-22 Gpnmb 0 0 0 0Many factors that perturb gene expression, like miRNA, show cumulative changes in their targets gene expression. Cumulative changes in the profile of genes expression can be visualized and tested with the emperical distribution function (ecdf) coupled with a statistical test such as the Kolmogorov-Smirnov test.
SeedMatchR provides functions for comparing the
log2(Fold Change) of two gene sets. The function
deseq_fc_ecdf is designed to work directly with a DESeq2
results data frame.
Required Inputs:
res: DESeq2 results data framegene.lists: A list of lists containing gene names# Gene set 1
mer7m8.list = res$gene_id[res$mer7m8 >= 1]
# Gene set 2
background.list = res$gene_id[res$mer7m8 == 0]
ecdf.results = deseq_fc_ecdf(res,
list("Background" = background.list,
"mer7m8" = mer7m8.list),
stats.test = "KS",
factor.order = c("Background",
"mer7m8"),
null.name = "Background",
target.name = "mer7m8",
alternative = "greater")
#> Comparing: Background vs. mer7m8
ecdf.results$plot