![]()
The goal of dfmirroR is to create mirrored version of data sets and output a string with the code to reproduce that copy. Data scientists often have questions about analyzing a specific data set, but in many cases cannot share their data.
dfmirrorR creates a copy of the data based on the distribution of specified columns. In recognition that we also often have questions we want to post publicly, and the need to create reproducable examples, the package also has functionality for outputting a simplified, pasteable version of code for creating the mirrored data frame object.
One neat thing about dfmirrorR is that it tests whether or not columns are normally distributed and mirrors the specified columns accordingly so that your “fake” data resembles your original data.
You can install the development version of dfmirroR from GitHub with:
# install.packages("devtools")
devtools::install_github("jacobpstein/dfmirroR")
#>
#> ── R CMD build ─────────────────────────────────────────────────────────────────
#> * checking for file ‘/private/var/folders/5m/kgrgm7ns0q10f7dp56dv4ylm0000gn/T/RtmpPA5DAX/remotes62227c0e005b/jacobpstein-dfmirroR-3c8ca46/DESCRIPTION’ ... OK
#> * preparing ‘dfmirroR’:
#> * checking DESCRIPTION meta-information ... OK
#> * checking for LF line-endings in source and make files and shell scripts
#> * checking for empty or unneeded directories
#> * building ‘dfmirroR_2.1.0.tar.gz’
You can install also the CRAN version of the package, but it’s not as good as the development version:
install.packages("dfmirroR")
#>
#> The downloaded binary packages are in
#> /var/folders/5m/kgrgm7ns0q10f7dp56dv4ylm0000gn/T//RtmpPA5DAX/downloaded_packagesThis is a basic example which shows you how to solve a common problem. Let’s say you are working with the airquality dataset. This contains a Wind column that is approximately normal based on a Shapiro-Wilk test and another column Ozone, which is non-normally distributed. You want to simulate a data set to test a model and need to mirror airquality but with more observations and then create a reproducible example.
Here’s what the Ozone column looks like in the original data:
library(dfmirroR)
library(ggplot2)

data(airquality)

# take a look at the Ozone variable

ggplot(airquality) +
  geom_histogram(aes(Ozone), col = "white", fill = "#AFDFEF", bins = 30) +
  theme_minimal() +
  labs(title = "Distribution of 153 Ozone observations from the airquality dataset")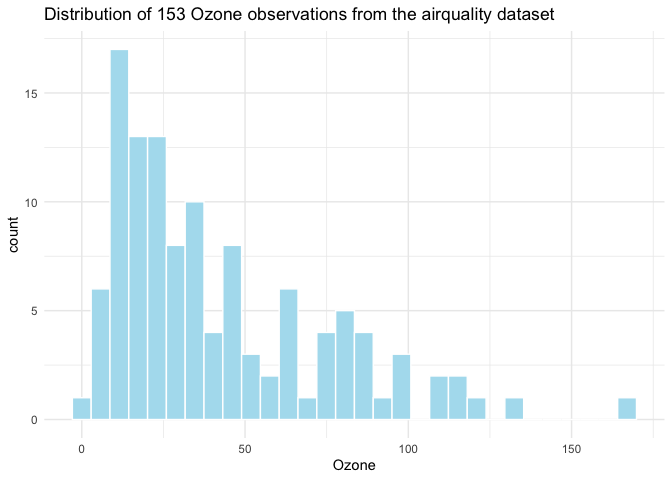
Now, let’s run dfmirrorR to create a similar column.
# set a seed
set.seed(3326)

air_mirror <- simulate_dataframe(airquality, num_obs = 1000, columns_to_simulate = c("Ozone", "Wind"))
This creates a list() object that contains a new data frame with 1,000 observations based on the distributions of the Ozone and Wind columns in the input_df.
Take a look at the mirrored colum for Ozone:
ggplot(air_mirror$simulated_df) +
  geom_histogram(aes(Ozone), col = "white", fill = "#AFDFEF", bins = 30) +
  theme_minimal() +
  labs(title = "Distribution of 1,000 Ozone observations from a mirrored dataset")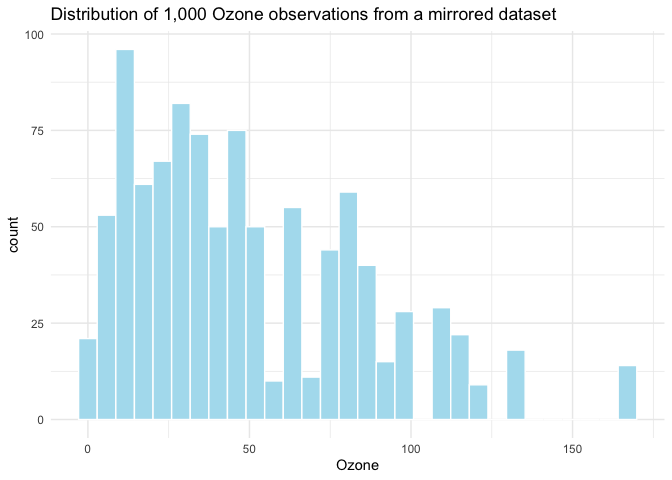
There are other packages that can mirror a dataframe. The excellent faux comes to mind. However, one addition of the dfmirroR package is that it prints code to add to a reproducible example if you need to ask a question on Stackoverflow or elsewhere.
For example, from our air_mirror list object above, we can extract the code object, which is just a string containing the relevant code. Combining this object with the cat() function provides clean, easily shareable output.
cat(air_mirror$code)
#> simulated_df <- data.frame(
#>   Ozone = sample(c(41, 36, 12, 18, NA, 28, 23, 19, 8, 7, 16, 11, 14, 34, 6, 30, 1, 4, 32, 45, 115, 37, 29, 71, 39, 21, 20, 13, 135, 49, 64, 40, 77, 97, 85, 10, 27, 48, 35, 61, 79, 63, 80, 108, 52, 82, 50, 59, 9, 78, 66, 122, 89, 110, 44, 65, 22, 31, 168, 73, 76, 118, 84, 96, 91, 47, 24, 46), 1000, replace = TRUE),
#>   Wind = rnorm(1000, mean = 9.95751633986928, sd = 3.51146940195185)
#> )This package is indebted to the great fitdistrplus package, which allows dfmirroR to dynamically mimic the distribution of input data. For more, see:
Marie Laure Delignette-Muller, Christophe Dutang (2015). fitdistrplus: An R Package for Fitting Distributions. Journal of Statistical Software. https://www.jstatsoft.org/article/view/v064i04 DOI 10.18637/jss.v064.i04.
This package relies on the skewness function from: David Meyer, et al. e1071.
The MASS package also provides some functionality. Learn more here: Venables WN, Ripley BD (2002). Modern Applied Statistics with S, Fourth edition. Springer, New York. ISBN 0-387-95457-0, https://www.stats.ox.ac.uk/pub/MASS4/
This package also pulls from the core R stats package. Special thanks to the R Core Team, without whom I would almost definitely be unemployed.