

tinytable is a small but powerful R package to draw beautiful tables in a variety of formats: HTML, LaTeX, Word, PDF, PNG, Markdown, and Typst. The user interface is minimalist and easy to learn, while giving users access to powerful frameworks to create endlessly customizable tables.
https://vincentarelbundock.github.io/tinytable/
There are already many excellent table-drawing packages in the R ecosystem. Why release a new one? As the maintainer of modelsummary, I needed a table-drawing package which was:
R package.[2]To achieve these goals, the design philosophy of tinytable rests on three pillars:
Data is separate from style. The code that this package creates keeps the content of a table separate from the style sheet that applies to its cells. This is in contrast to other R packages that modify the actual text in each cell to style it. Keeping data and style separate allows tinytable to create human-readable files which are easy to edit, debug, and extend. It also enables developers to keep a simpler code base, with minimal use of messy regular expressions.
Flexibility. Users’ needs are extremely varied, and a table-drawing package must be flexible enough to accomodate different ideas. To achieve this, tinytable builds on battle-tested and versatile frameworks like Bootstrap for HTML and tabularray for LaTeX.
Lightweight is the right weight. Some of the most popular table-drawing packages in the R ecosystem are very heavy: A single library() call can sometimes load upwards of 65 R packages. In contrast, tinytable imports zero 3rd party R package by default.
Install the stable version from CRAN:
tinytable is a relatively new package with rapid development. If you want to benefit from the latest features—showcased on the package website—you may want to install the development version from Github.
Restart R completely for the installation to take effect.
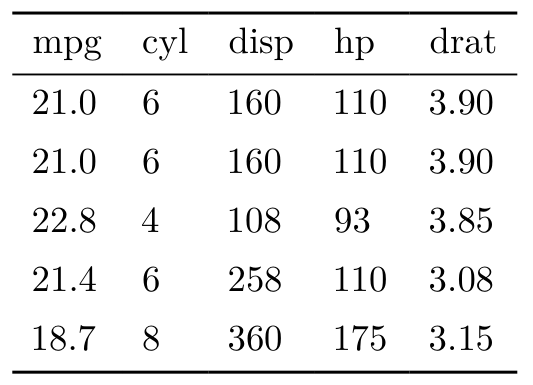
The best feature of tinytable is its simplicity. To draw a table, simply call the tt() function with your data frame as the first argument:
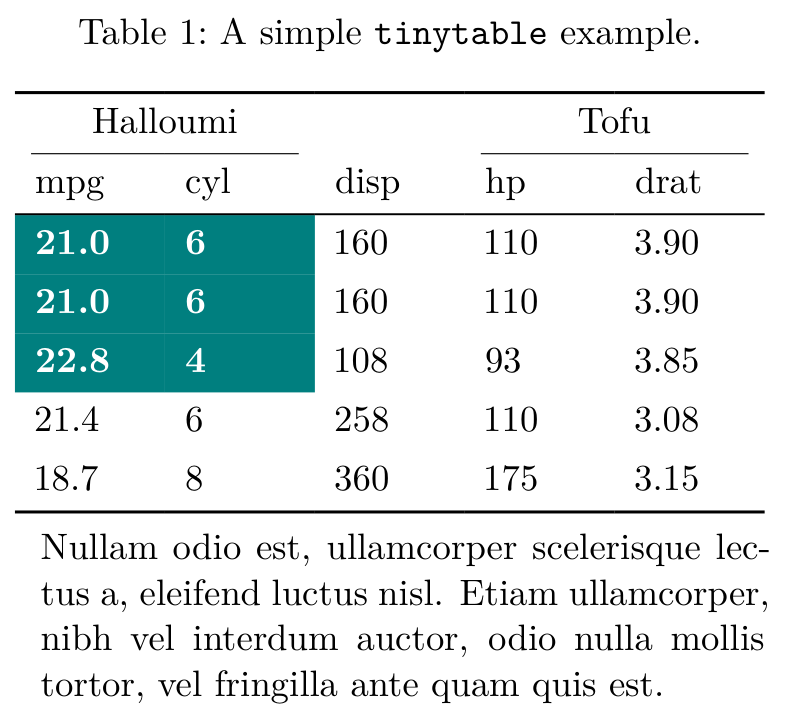
More complex tables can be created by calling arguments and chaining functions together. In the next example, we add a caption, footnote, colors, styles, and spanning column headers:
cap <- "A simple \\texttt{tinytable} example."
not <- "Nullam odio est, ullamcorper scelerisque lectus a, eleifend luctus nisl. Etiam ullamcorper, nibh vel interdum auctor, odio nulla mollis tortor, vel fringilla ante quam quis est."

tt(x,
   caption = cap,
   notes = not,
   width = .5) |>
 style_tt(
   i = 1:3,
   j = 1:2,
   background = "teal",
   color = "white",
   bold = TRUE) |>
 group_tt(
   j = list("Halloumi" = 1:2, "Tofu" = 4:5))
The tinytable tutorial will take you much further. It is available in two formats:
[1] Other formats like Markdown and Typst are also available, but less flexible.
[2] Some extra packages can be imported to access specific functionality, such as integration with Quarto, inserting ggplot2 objects as inline plots, and saving tables to PNG images or PDF documents.