![]()

![]()
![]()


The goal of climaemet is to provide an interface for downloading climate data from the Spanish Meteorological Agency (AEMET) directly in R and for creating scientific visualizations, including climate charts, climate time series trend analysis, temperature and precipitation anomaly maps, warming stripes and climatograms.
Browse the manual and vignettes at https://ropenspain.github.io/climaemet/.
AEMET Open Data is a REST API developed by AEMET for disseminating and reusing the agency’s meteorological and climatological information. For more details, visit https://opendata.aemet.es/centrodedescargas/inicio.
Information prepared by the Spanish Meteorological Agency (© AEMET). You can read about it here.
A summary of data usage is:
People can use these data freely. You should mention AEMET as the collector of the original data in every situation except when you are using these data privately and individually. AEMET makes no warranty as to the accuracy or completeness of the data. All data are provided on an “as is” basis. AEMET is not responsible for any damage or loss derived from the interpretation or use of these data.
Install the released version of climaemet from CRAN with:
install.packages("climaemet")Install the development version of climaemet from r-universe:
# Install climaemet in R:
install.packages(
  "climaemet",
  repos = c(
    "https://ropenspain.r-universe.dev",
    "https://cloud.r-project.org"
  )
)
Alternatively, install the development version of climaemet with:
# install.packages("pak")
pak::pak("ropenspain/climaemet")To download data from AEMET, you need a free API key, which you can get here.
library(climaemet)

## Get API key from AEMET.
browseURL("https://opendata.aemet.es/centrodedescargas/altaUsuario")

## Use this function to register your API key temporarily or permanently.
aemet_api_key("MY API KEY")The apikey argument in the functions is now deprecated.
You may need to set your API key globally using
aemet_api_key(). Note that you also need to remove the
apikey argument from older code.
From version 1.0.0 onward, climaemet provides its results in tibble format. The functions also try to infer the correct format of fields. For example, date and hour fields are parsed as date-time objects, and numeric fields are parsed as doubles.
library(climaemet)

# See a tibble in action

aemet_last_obs("9434")
#> # A tibble: 12 × 25
#>    idema   lon fint                 prec   alt  vmax    vv    dv   lat  dmax
#>    <chr> <dbl> <dttm>              <dbl> <dbl> <dbl> <dbl> <dbl> <dbl> <dbl>
#>  1 9434  -1.00 2026-06-03 01:00:00     0   249  11.2   8.4   300  41.7   290
#>  2 9434  -1.00 2026-06-03 02:00:00     0   249  12.8   8.1   305  41.7   305
#>  3 9434  -1.00 2026-06-03 03:00:00     0   249  10.6   7.6   300  41.7   303
#>  4 9434  -1.00 2026-06-03 04:00:00     0   249  12     7.1   317  41.7   295
#>  5 9434  -1.00 2026-06-03 05:00:00     0   249  11.9   8     312  41.7   313
#>  6 9434  -1.00 2026-06-03 06:00:00     0   249  12.5   7.7   308  41.7   318
#>  7 9434  -1.00 2026-06-03 07:00:00     0   249  12.1   7.8   316  41.7   303
#>  8 9434  -1.00 2026-06-03 08:00:00     0   249  12.4   9.9   312  41.7   303
#>  9 9434  -1.00 2026-06-03 09:00:00     0   249  13.3   8.5   306  41.7   290
#> 10 9434  -1.00 2026-06-03 10:00:00     0   249  12.2   7.9   310  41.7   303
#> 11 9434  -1.00 2026-06-03 11:00:00     0   249  12.2   6.1   312  41.7   310
#> 12 9434  -1.00 2026-06-03 12:00:00     0   249  15.7   6.6   323  41.7   320
#> # ℹ 15 more variables: ubi <chr>, pres <dbl>, hr <dbl>, stdvv <dbl>, ts <dbl>,
#> #   pres_nmar <dbl>, tamin <dbl>, ta <dbl>, tamax <dbl>, tpr <dbl>,
#> # stddv <dbl>, inso <dbl>, tss5cm <dbl>, pacutp <dbl>, tss20cm <dbl>Another major change in version 1.0.0 is the ability to return
information as spatial sf objects using
return_sf = TRUE. The coordinate reference system (CRS) is
EPSG:4326, which corresponds to the World
Geodetic System 1984 (WGS 84) and returns coordinates in
latitude/longitude (unprojected coordinates):
# You need to install sf if it is not already installed.
# Run install.packages("sf") to install it.
library(ggplot2)
library(dplyr)
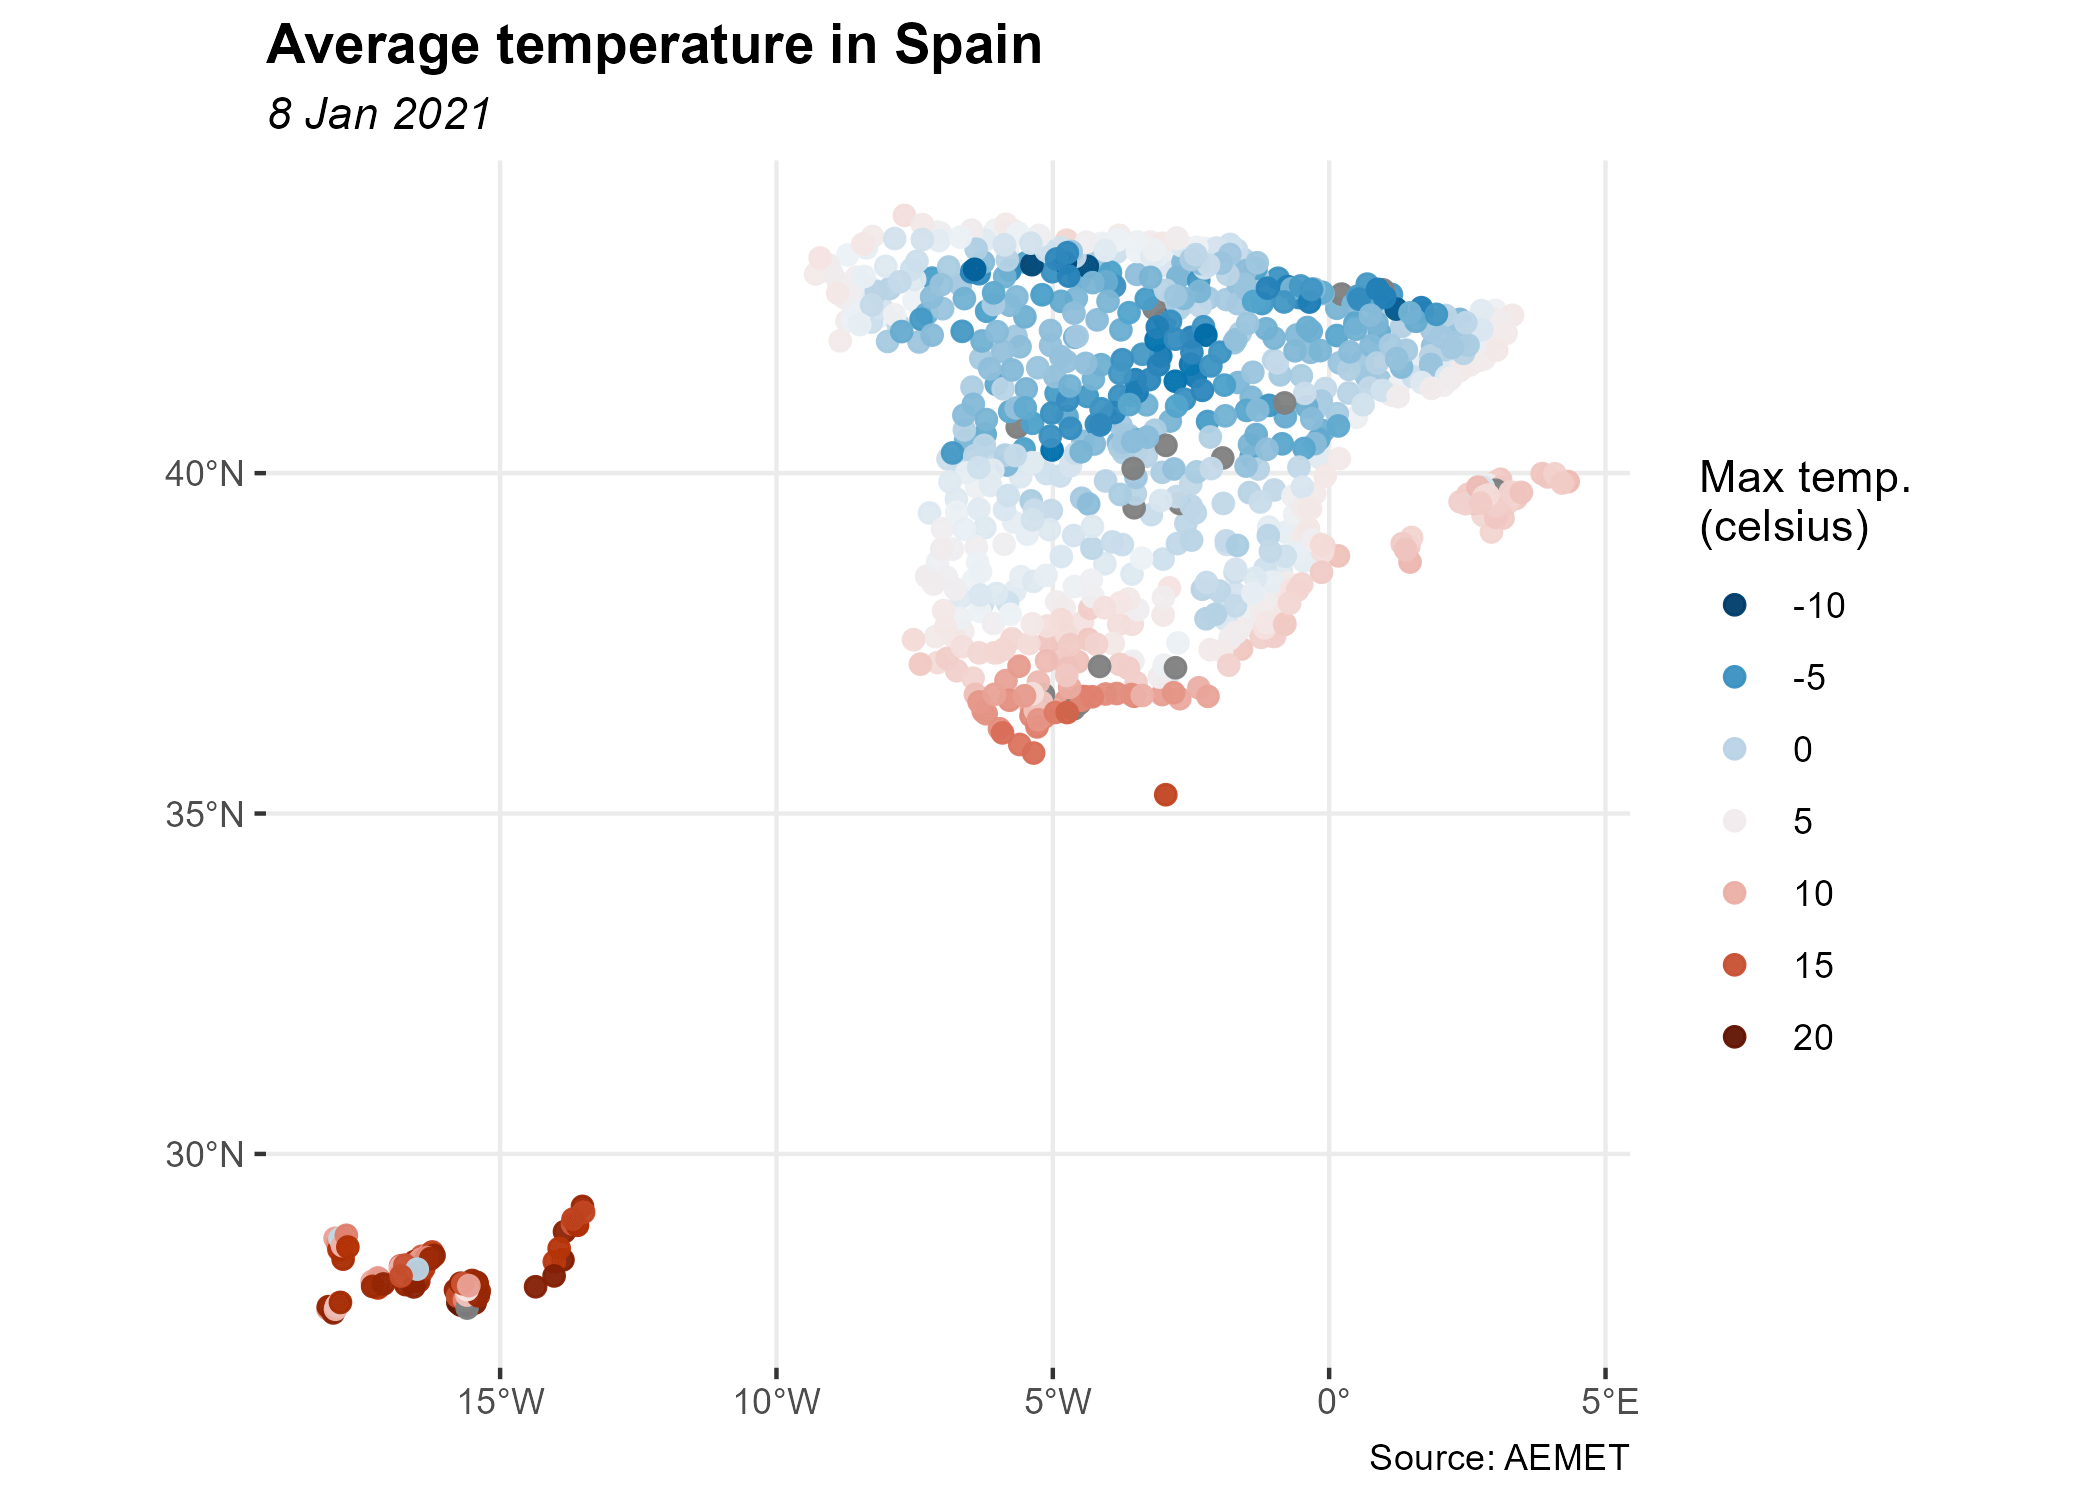
all_stations <- aemet_daily_clim(
start = "2021-01-08",
end = "2021-01-08",
return_sf = TRUE
)
ggplot(all_stations) +
geom_sf(aes(colour = tmed), shape = 19, size = 2, alpha = 0.95) +
labs(
title = "Average temperature in Spain",
subtitle = "8 Jan 2021",
color = "Max temp.\n(celsius)",
caption = "Source: AEMET"
) +
scale_colour_gradientn(
colours = hcl.colors(10, "RdBu", rev = TRUE),
breaks = c(-10, -5, 0, 5, 10, 15, 20),
guide = "legend"
) +
theme_bw() +
theme(
panel.border = element_blank(),
plot.title = element_text(face = "bold"),
plot.subtitle = element_text(face = "italic")
)
You can also draw a warming stripes graph from downloaded weather station data. These functions return ggplot2 plots:
# Plot a climate stripes graph for a period of years for a station.

library(ggplot2)

# Example data
temp_data <- climaemet::climaemet_9434_temp

ggstripes(temp_data, plot_title = "Zaragoza Airport") +
  labs(subtitle = "(1950-2020)")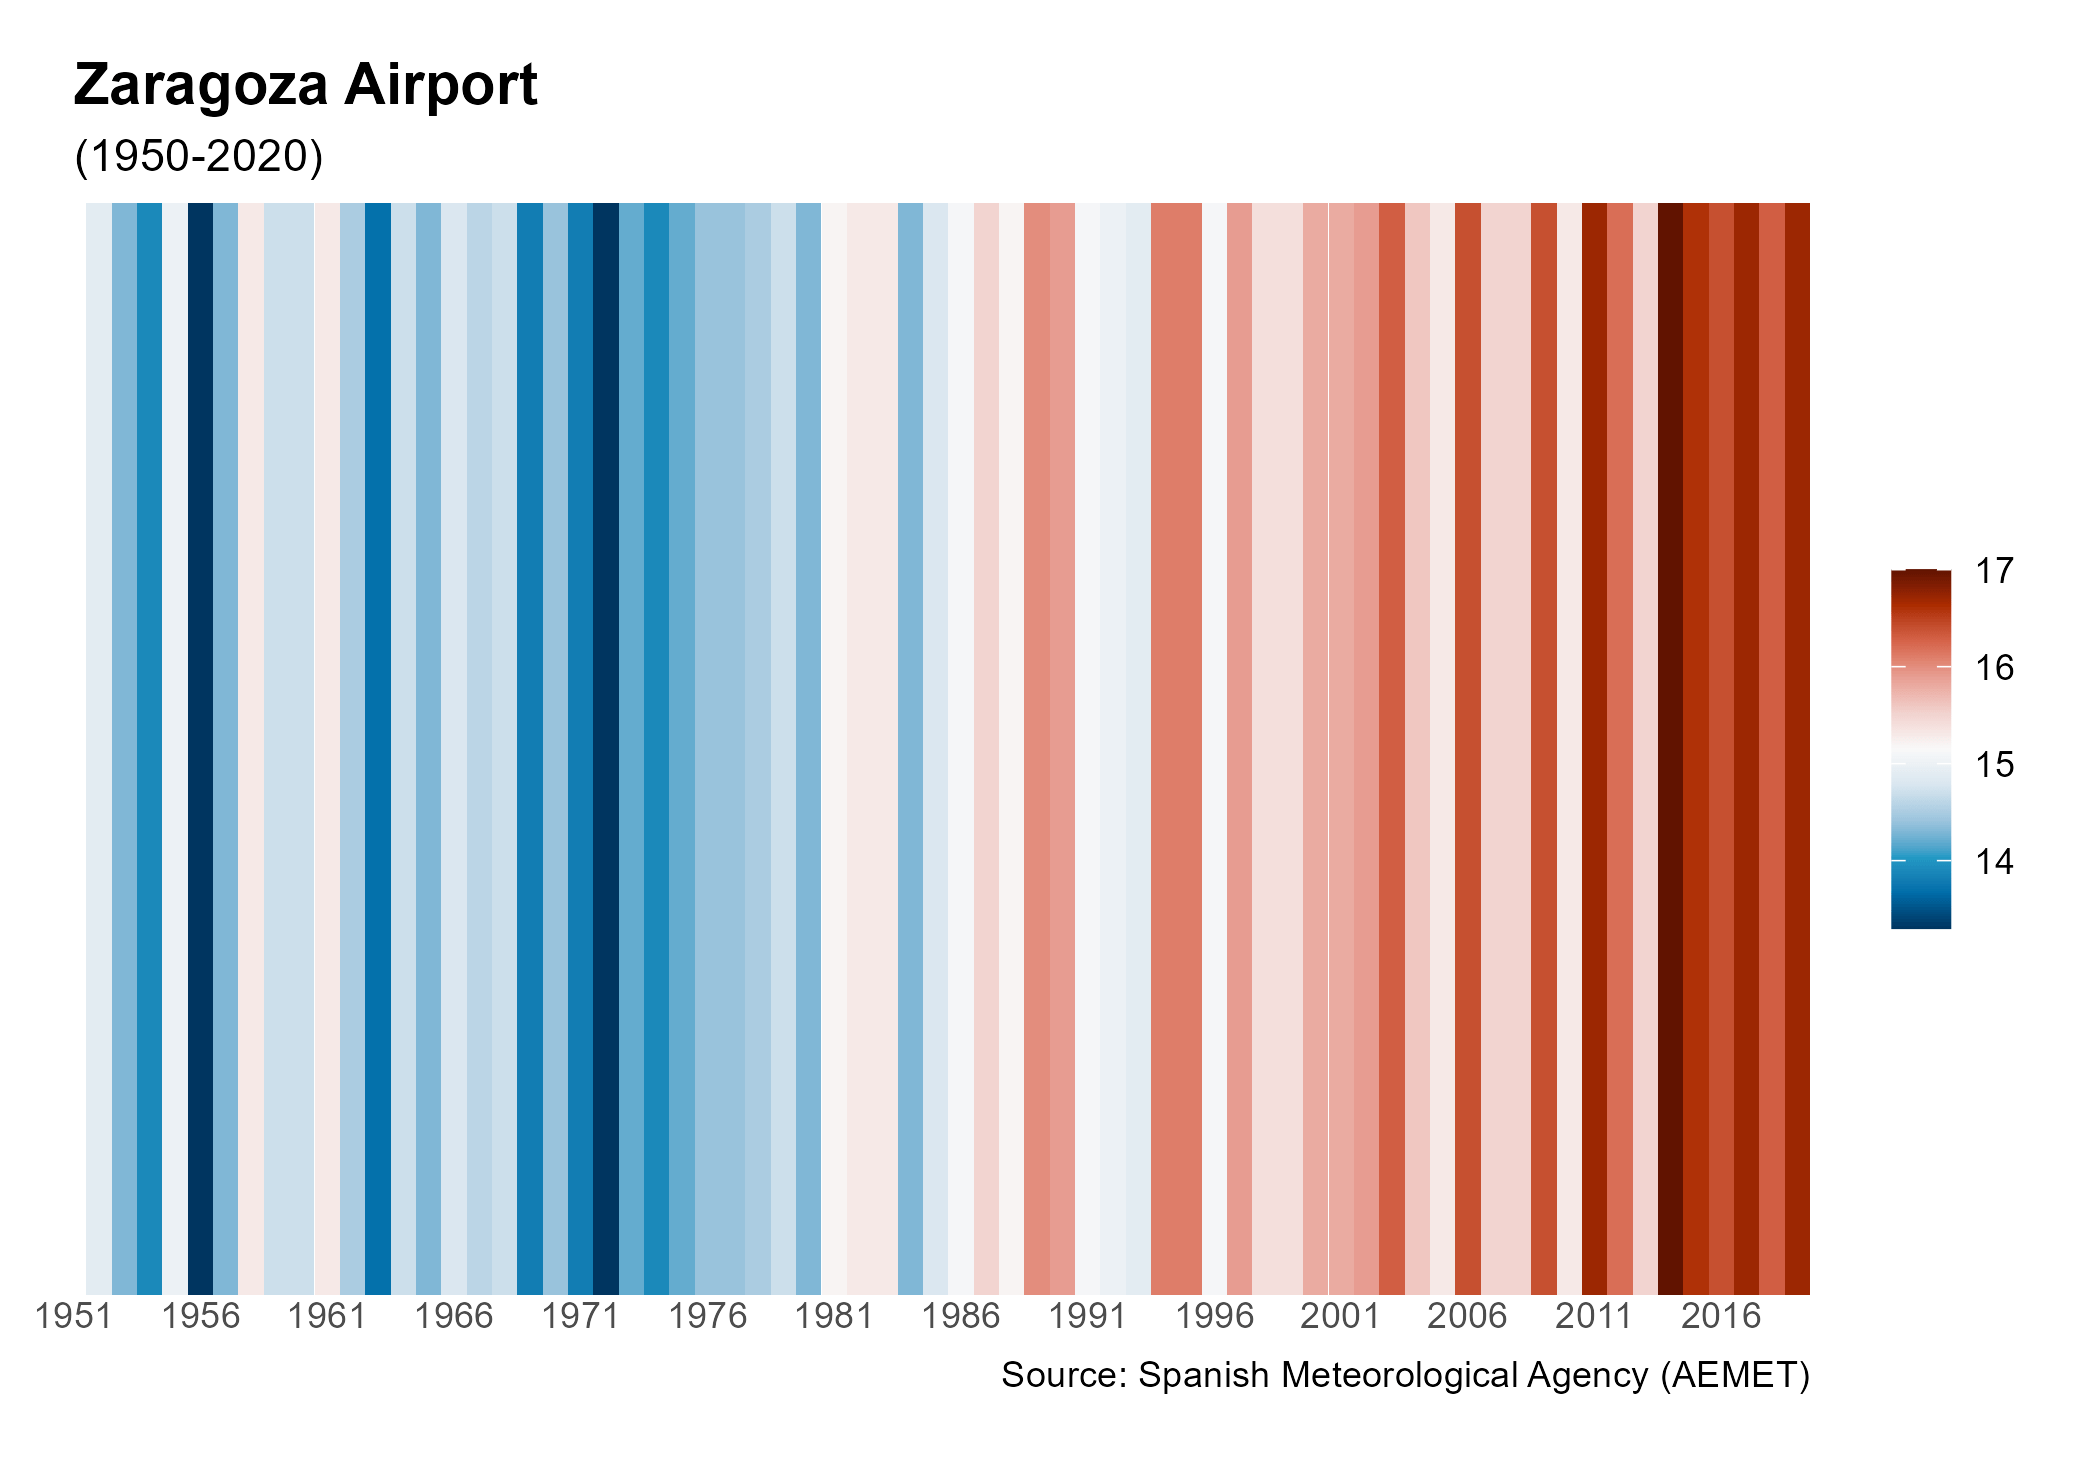
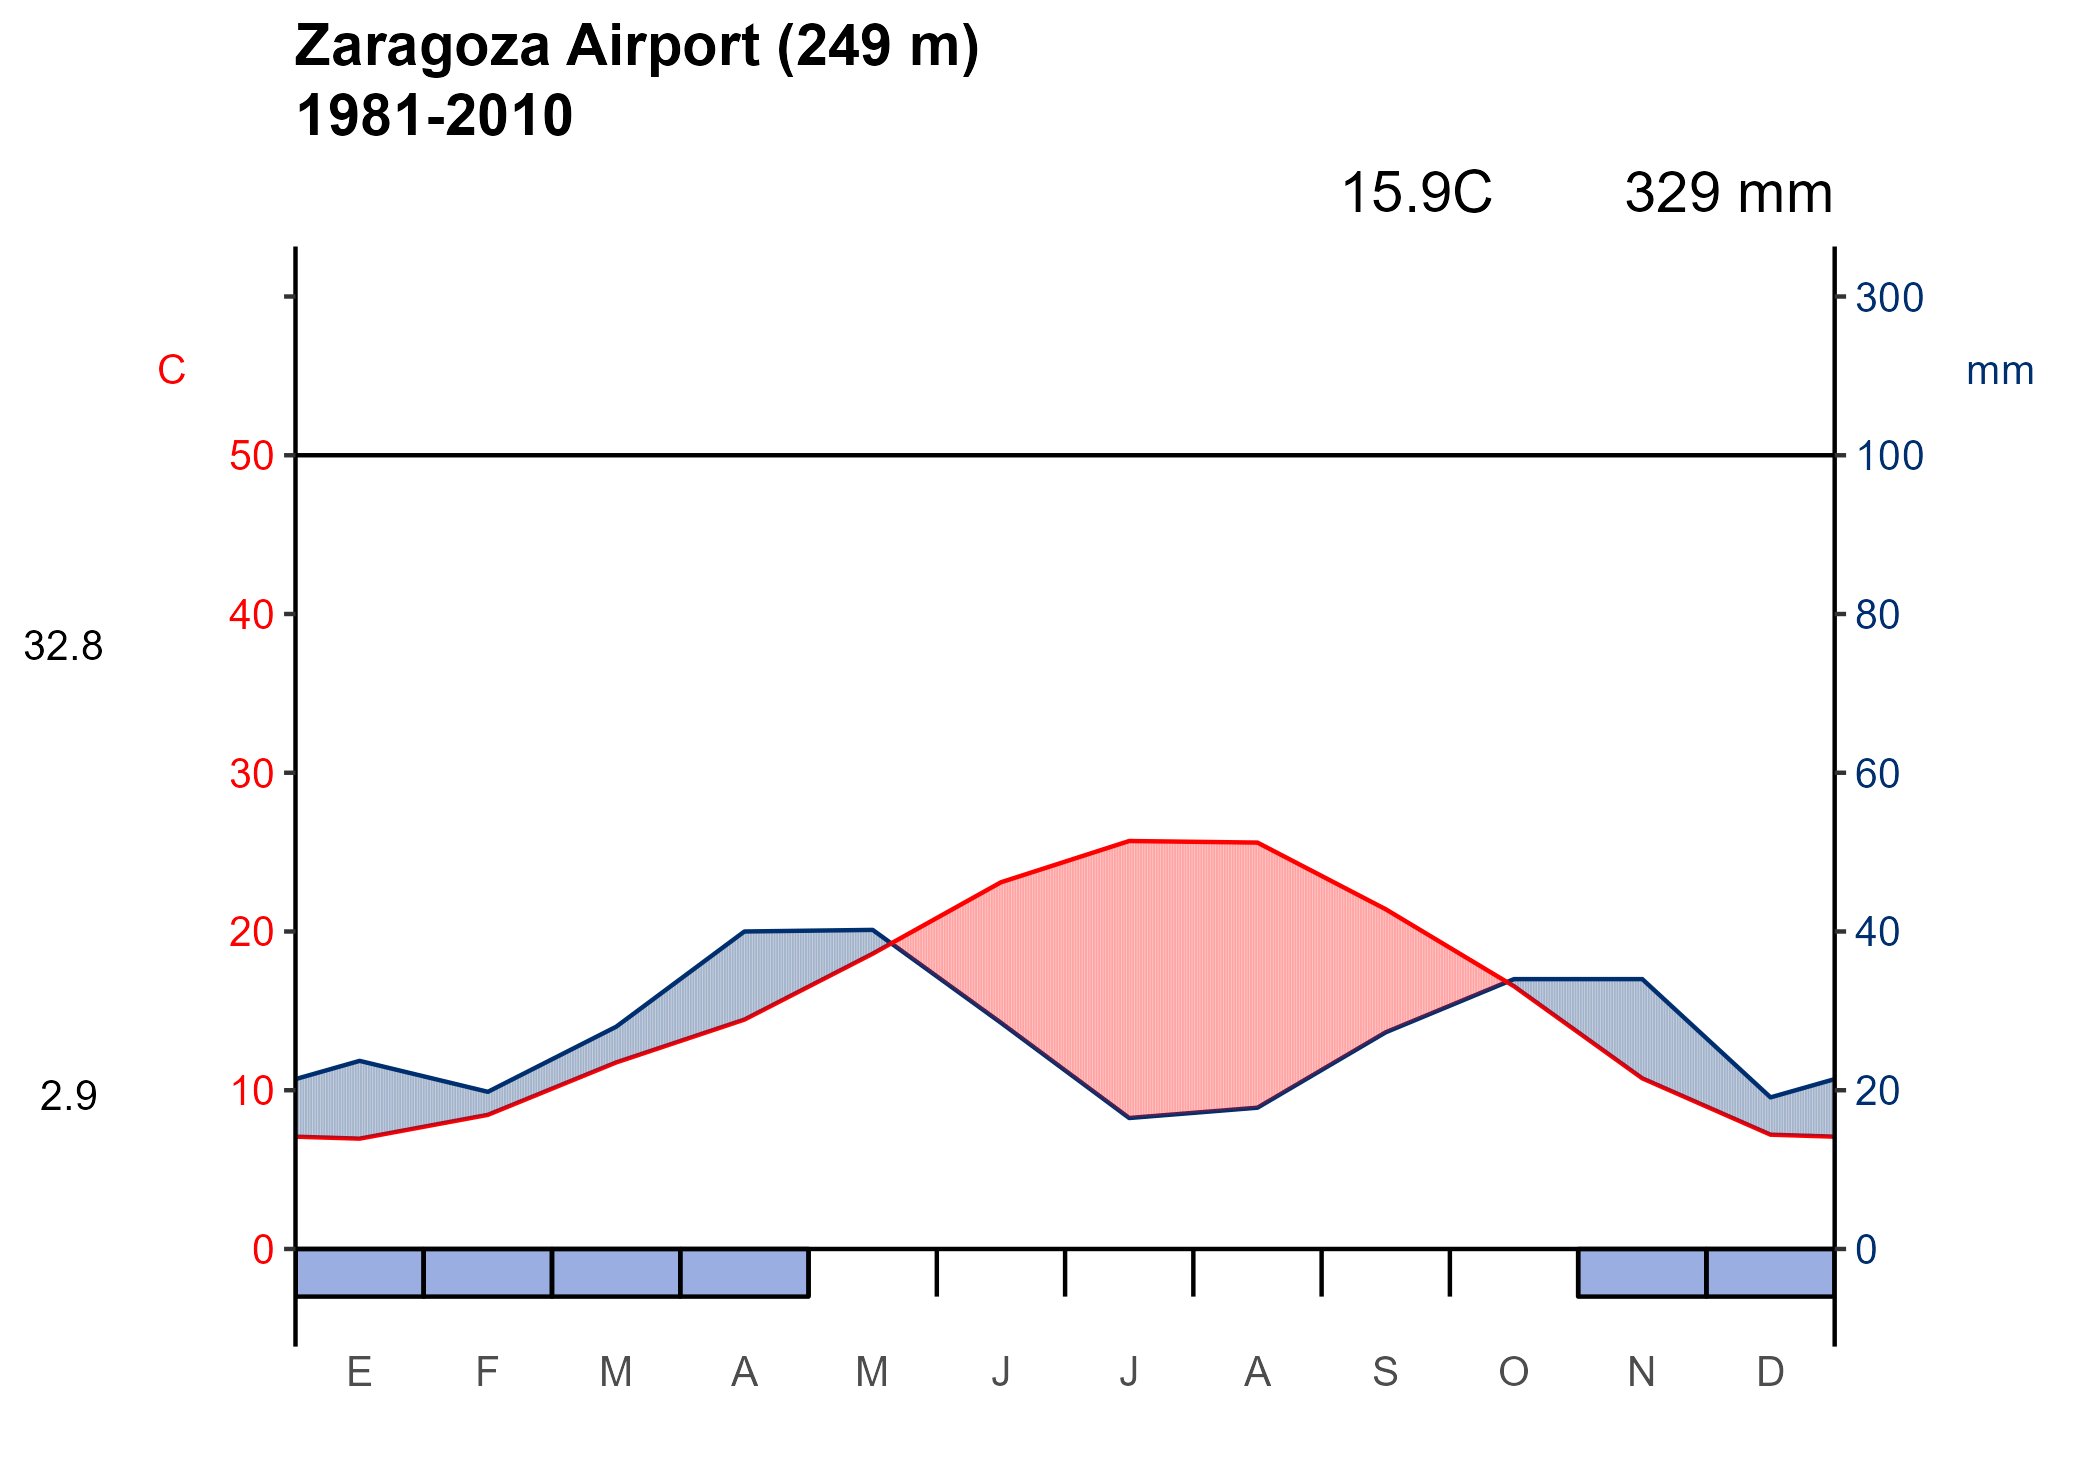
You can also draw the well-known Walter & Lieth climatic diagram for a weather station over a specified period:
# Plot a Walter & Lieth climatic diagram for a station.

# Example data
wl_data <- climaemet::climaemet_9434_climatogram

ggclimat_walter_lieth(
  wl_data,
  alt = "249",
  per = "1981-2010",
  est = "Zaragoza Airport"
)
Additionally, you can plot wind speed and direction over time from weather station data.
# Plot a windrose showing wind speed and direction for a station.

# Example data
wind_data <- climaemet::climaemet_9434_wind

speed <- wind_data$velmedia
direction <- wind_data$dir

ggwindrose(
  speed = speed,
  direction = direction,
  speed_cuts = seq(0, 16, 4),
  legend_title = "Wind speed (m/s)",
  calm_wind = 0,
  n_col = 1,
  plot_title = "Zaragoza Airport"
) +
  labs(subtitle = "2000-2020", caption = "Source: AEMET")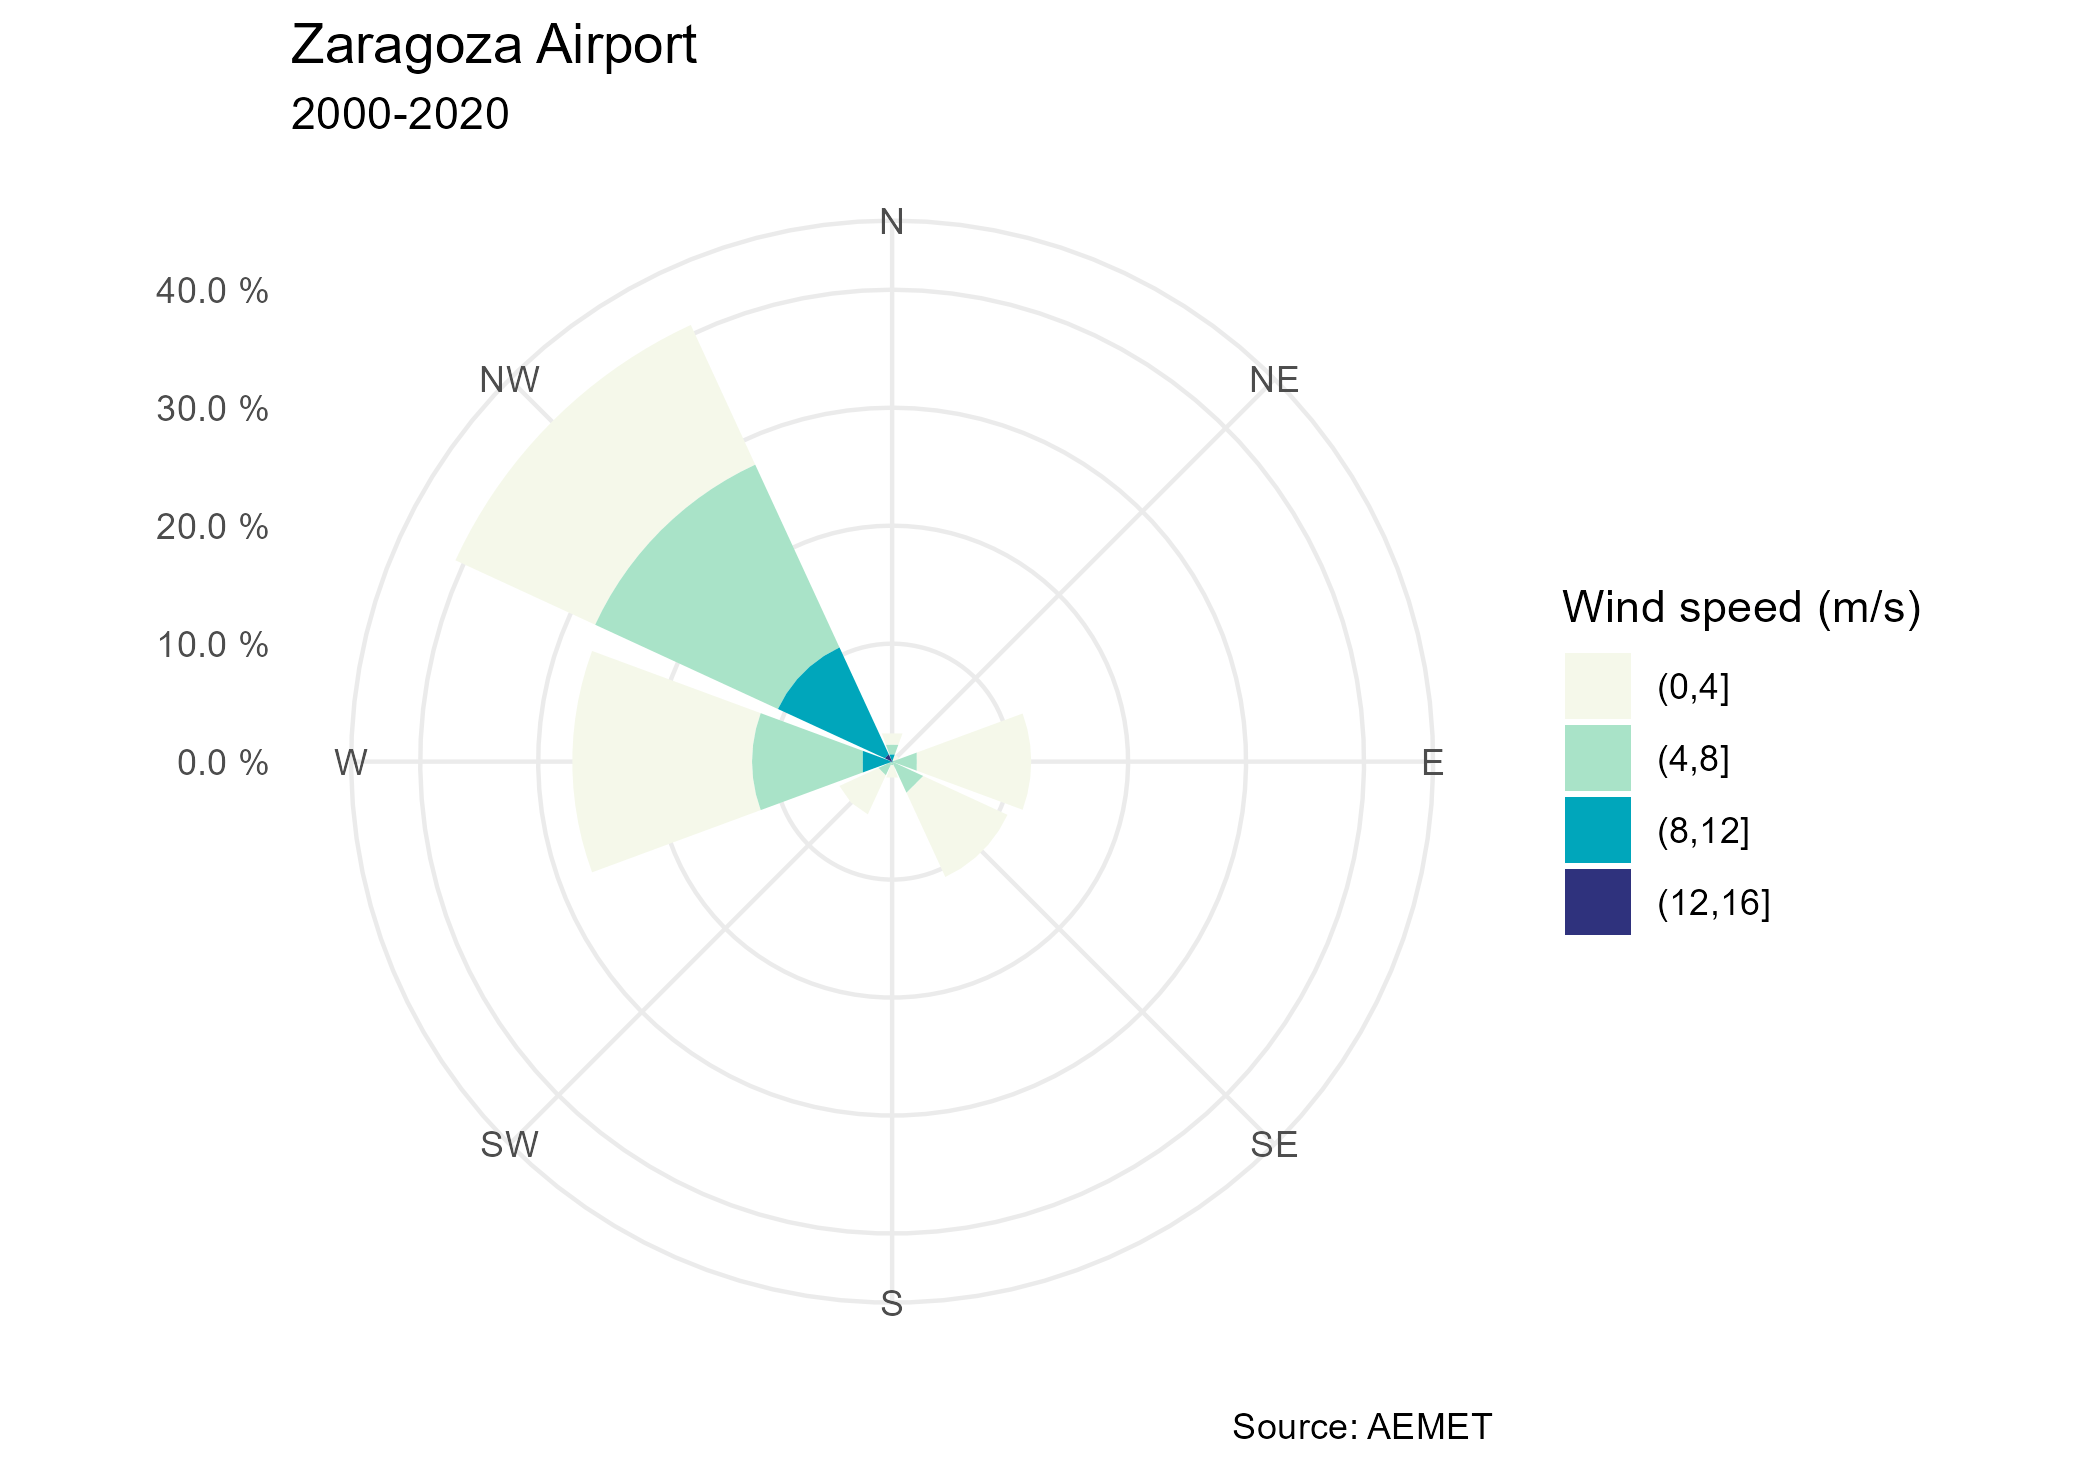
Please note that this project is released with a Contributor Code of Conduct. By participating in this project you agree to abide by its terms.
If you use climaemet in a paper, please consider citing it:
Pizarro M, Hernangómez D, Fernández-Avilés G (2021). climaemet: Climate AEMET Tools. doi:10.5281/zenodo.5205573.
A BibTeX entry for LaTeX users is:
@Manual{10261_250390,
  author = {Manuel Pizarro and Diego Hernangómez and Gema Fernández-Avilés},
  title = {{climaemet}: Climate {AEMET} Tools},
  year = {2021},
  abstract = {The goal of climaemet is to serve as an interface to download the climatic data of the Spanish Meteorological Agency (AEMET) directly from R using their API (https://opendata.aemet.es/) and create scientific graphs (climate charts, trend analysis of climate time series, temperature and precipitation anomalies maps, “warming stripes” graphics, climatograms, etc.).},
  doi = {10.5281/zenodo.5205573},
}